I want to get away, I want to fly away… How Travel Big Data helps uncovering global events

Working with data can be fascinating. With our collective experience of twenty-five years dedicated to professional data analysis, we have gained a profound understanding of its intricacies. Furthermore, we’re lucky to operate in a data-rich environment. It’s complex, but in terms of business, relatively easy for humans to grasp.
Our company, Sabre, is a leading technology provider for the travel industry. Every day, we process massive amounts of raw data, measured in petabytes. For example, a data analyst working within solely the air search domain would typically receive up to a billion processed records from our search API service per day, each consisting of dozens of nested data structures, producing (after flattening) hundreds of dimensions and measures.
Sometimes, the data we handle forms into patterns that align with long-standing trends we’ve observed. At times, an experienced industry analyst might formulate the initial hypothesis even before looking closely at the numbers, awaiting query results to confirm the initial suspicions. Yet, from time to time, unexpected events take place.
By the end of 2019, the Western world began receiving reports of concerning cases of pneumonia of unknown origin occurring in China. Needless to say, what followed in the subsequent months was the global spread of the pandemic, resulting in widespread loss of life and significant disruptions across various business sectors.
Unfortunately, we found ourselves confronted with observing this impact from the lens of the travel industry. In the following article, we would like to share our insights on this experience. Our intention will not be to conduct a detailed analysis of Covid chronology versus air traffic data; instead, with several examples we will underline how air search logs may reflect global events. We will focus on the first months of the pandemic, where the impact on the global market was most shocking.
The flight search data used in the analysis represents queries originating from Sabre customers (comprising airlines and travel agencies) to Sabre air shopping API – the service utilised by Sabre’s clients for searching flight connections. Those calls were intercepted and processed; after which specific payload (content) attributes, such as flight dates, journey origin and journey destination, were transformed and stored in Big Query tables in the Google Cloud environment. Worth mentioning is that, although the calls to Sabre systems reflect a significant search traffic volume, given the company’s prominent position in the industry, they don’t cover the entire landscape.
The information on diagnosed COVID-19 cases comes from the COVID-19 Data Repository by the Center for Systems Science and Engineering (CSSE) at Johns Hopkins University, available at https://github.com/CSSEGISandData/COVID-19.
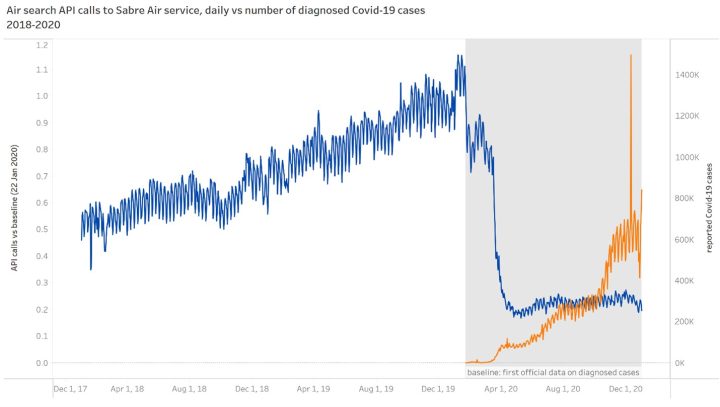
To uphold the confidentiality of company data, we will not cite actual numbers on production traffic. Instead, we will show changes versus traffic registered on a baseline date (22 Jan 2020; on that date, we received the first reports on diagnosed COVID-19 cases globally). Presenting a shift in search trends is sufficient to illustrate the impact of the pandemic on the global flight industry.
General trends & first signs
The first outbreak was detected in Wuhan in December 2019. Usually, this time of the year brings high flight traffic volume in the Asia region—Chinese New Year leads to an increased number of flight searches. However, 2020 was different. The last days of January brought decreasing traffic in the area, which resulted in an overall slowdown (-20% of API calls compared to the baseline date).
The worst was yet to come. Following the global pandemic outbreak in March 2020, there was an 80% decline in overall flight search volume, which stabilised at that level in the subsequent months (see figure 1: Air search API calls to Sabre Air service, daily vs. number of diagnosed COVID-19 cases).
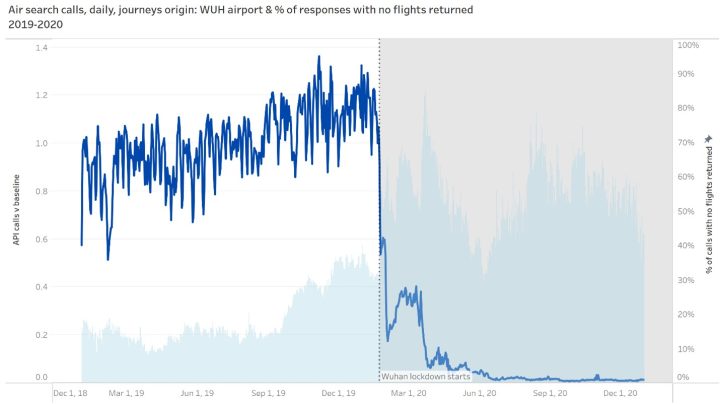
Analysis of search data for journeys originating from Wuhan, the epicentre of the pandemic, shows a complete closure of the flight traffic from this airport. The official lockdown in Wuhan started on January 23rd, 2020. The subsequent day witnessed an almost 50% decrease in the number of flight searches compared to the baseline date – a change beyond the usual daily fluctuation level. The volume experienced a slight increase shortly after Wuhan officials announced that trapped visitors may leave, then drastically reduced to reach only 1% of the pre-pandemic volume by the second half of 2020. By the end of the year the Wuhan airport became extinct.
Even before the significant declines in the air search volume, we experienced a growth within the share of air connection searches that returned no flights for the given criteria. Such a situation normally arises for various reasons, such as the absence of scheduled connections for specified origin and destination pairs, dates and carriers. However, the initial pre-pandemic level increased from 15% in the last months of 2019 to 30% in January 2020, reaching its maximum of 85% in March. After the local lockdown, where people continued to seek ways to leave the city, flights were simply unavailable (see fig. 2: Air search calls, daily, journeys origin: WUH airport & number of responses with no flights returned).
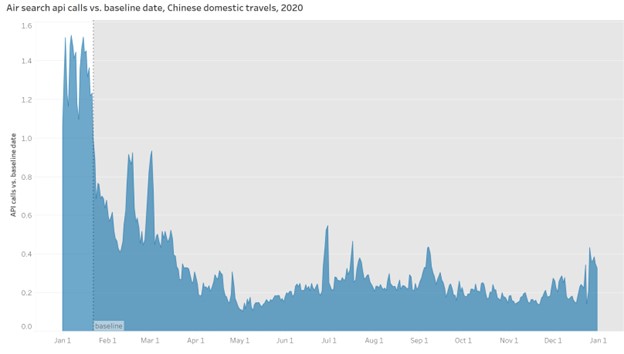
Concerning all travels originating from China, initial declines in January are succeeded by two search peaks, notably centred around efforts to return home or leave the area (mid-February and early March), seemingly related to local lockdowns (see fig. 3).
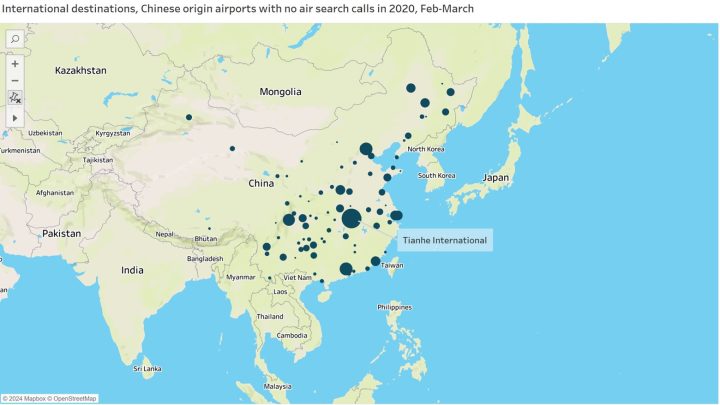
Nearly all Chinese airports experienced severe restrictions in terms of air traffic, primarily due to government decisions regarding the closure of air connections from China to selected countries. The level of change was not uniform. However, in some aviation facilities, the search traffic to several (previously frequently sought-for) destinations ceased completely. Figure 4 presents Chinese airports with a recorded number of searches in 2019 and a zero-search volume for journeys to selected destinations in 2020; the bubble size represents the total search traffic for the affected origin & destination pairs in 2019. Again, Tianhe International, the main airport in Wuhan, emerges as the most affected site.
People migration and first local epicentres outside China
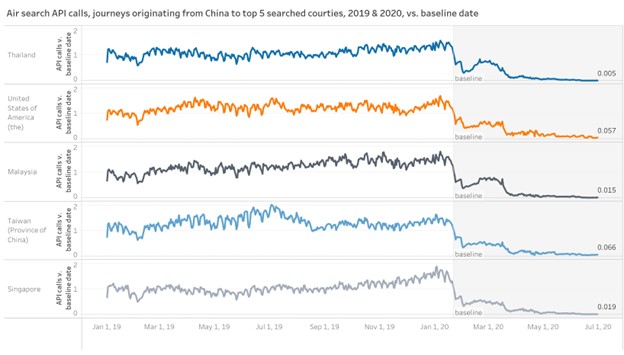
Before the complete shutdown of air services and lockdowns in China, some destinations may have witnessed non-standard people movements from areas impacted by the disease. In January 2020, the regular search traffic within the top searched international destinations followed a similar trend (see fig. 5: Air search API calls, journeys originating from China to top 5 searched countries, 2019 and 2020, vs. baseline date). However, we observed anomalies within the top-searched airports, where interest was previously low before the pandemic.
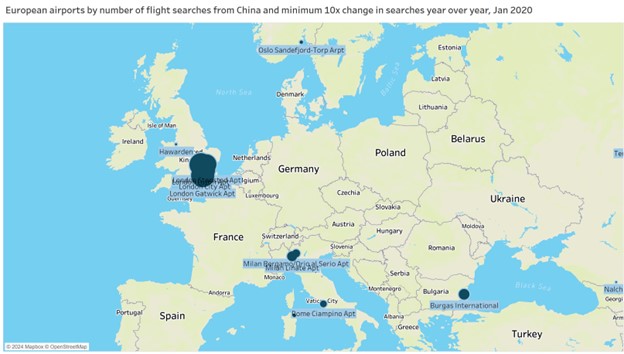
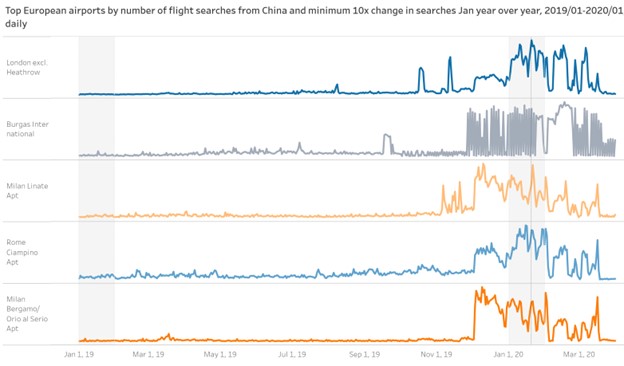
The search popularity rankings have shifted, introducing entirely new destinations and highlighting emerging stars within the constellation of the most sought-after European airports. Interestingly, locations with the highest growth ratio compared to 2019 (although the increase in interest began in the preceding months, starting from December 2019) are as follows: Bergamo, Milan, London (airports other than Heathrow), Rome, and Burgas. These cities are consistent with the first local epicentres of the disease (except Burgas in Bulgaria). Given that the popularity of these places did not start with the outbreak in China but earlier, a natural question arises: did the shift in trend coincide with the concurrent spread of the virus (see fig. 6, fig. 7).
In the following months, we witnessed further shifts within the landscape of top destinations for travellers originating from China. On the one hand, new destinations emerged as “rising stars”, while previously favoured locations experienced a significant decline in search traffic. This decline also affected domestic destinations within China and Wuhan, which vanished entirely from the rankings.
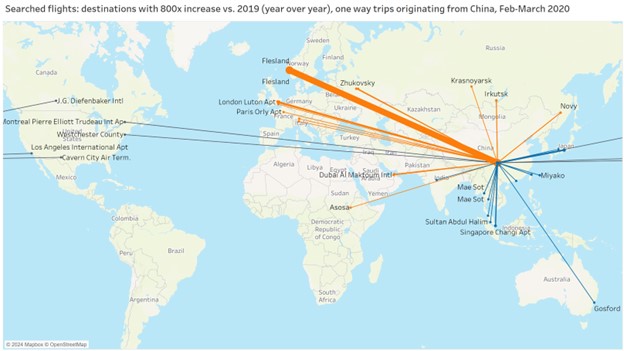
The top-searched international destinations for one-way trips seem to reflect the imaginative pursuits of travellers seeking alternative ways out of China amidst the era of restricted air travel. The new ranking includes localisations like Norwegian Bergen, airports of Tajikistan, Uzbekistan, and cities situated on the outskirts of Russia, near Chinese border, like Novosibirsk, Irkutsk (see fig. 8 for locations with a growth rate exceeding 800 times).
Global spread and related changes
The timeline for Covid-related changes affecting air search trends takes on a different shape for the rest of the world than journeys related to China. An important date for this type of travel appears to be March 11, 2020, when the WHO declared a global pandemic, and the virus was reported in 114 countries. This information prompted a state of epidemic emergency and subsequent travel restrictions in many countries. These measures were reflected in travellers’ behaviour, as people once again began seeking means to return home from various parts of the world.
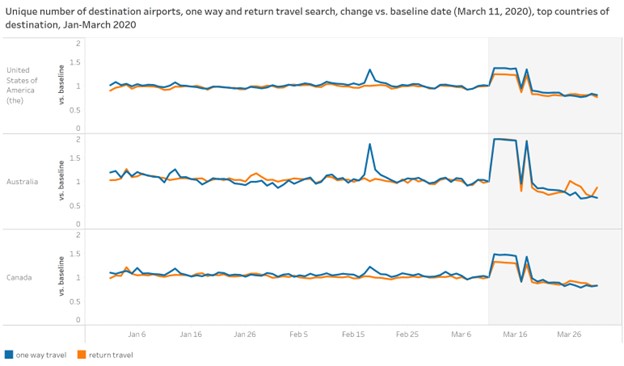
The map of searched international connections became more intricate, with numerous airports that previously had low interest breaking their search records. The first noticeable increase in the number of unique airports observed in the search requests occurred on February 18th. This day marked two events that gathered extended media coverage – the death from the virus of the head of the Wuhan hospital and the evacuation from the Princess Diamond ship quarantined in Japan due to coronavirus. Another peak in search activity, reflecting travellers’ intensified efforts to find alternative flight connections through a higher-than-usual number of airports, was spotted on March 11th, when the WHO declared a global pandemic (see fig. 9: unique number of travel destination airports).
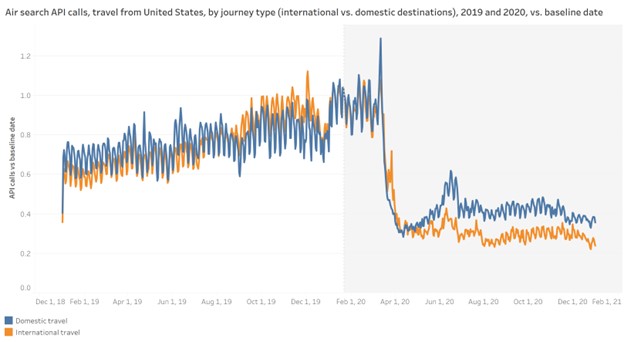
The subsequent months of the pandemic brought further changes in travellers’ habits. For example, in regions like the US, where air travel is a common mode of daily transportation, domestic travel has taken precedence over international journeys (see fig. 10).
Changes in trends and post-Covid recovery times vary depending on the region of the world, given the significant differences in local authorities’ responses to the pandemic. Further analysis seems to be an excellent topic for in-depth investigation, deserving its own dedicated story.
When writing this article – four years after the pandemic outbreak – search volumes are approaching pre-pandemic levels. The catastrophic impact on the air travel industry was undeniable and unprecedented. However, the industry is slowly recovering, prompting businesses to reflect on their strategies as well. For example, the significance of additional services purchased along with flights, such as the ability to cancel or reschedule connections, is increasing – a logical outcome of the pandemic events.
Looking back, one question emerges naturally: could we have leveraged data to anticipate the upcoming events better? The data can be a powerful weapon to support business decisions. It should allow us to track and forecast large-scale trends and patterns. However, there are situations where the power of data is limited to reacting to current situations and may not necessarily facilitate long-term planning. No traffic forecasts accounted for the unprecedented pandemic plunge. Still, the visibility we had helped in course correction, allowing for swift, near real-time tactical adjustments to the situation.
After all, data is not just about prediction; its value also lies in the ability to react quickly to changes beyond our control.